
Land Cover Trends Completed
Land Cover Trends was a research project focused on understanding the rates, trends, causes, and consequences of contemporary U.S. land use and land cover change. The project spanned from 1999 to 2011. The research was supported by the Climate and Land Use Change Research and Development Program of the U.S. Geological Survey (USGS) and was a collaborative effort with the U.S. Environmental Protection Agency (EPA) and the National Aeronautics and Space Administration (NASA). The project spanned from 1999 to 2011. Ongoing research is being conducted as part of the Land Change Research Project.
Background
A clear call for research on land use and land cover change resulted from the National Research Council (NRC) response to a National Science Foundation (NSF) request to identify the "Grand Challenges in Environmental Sciences" (NRC, 2001). An interdisciplinary committee was asked to determine the most important research challenges over the next 20 to 30 years within the context of environmental problems. One of eight grand challenges was Land Use Dynamics, which calls for the development of a comprehensive understanding of changes in land use and land cover that are critical to biogeochemical cycling, ecosystem functioning and services, and human welfare. The report concluded that “…improved information on and understanding of land use and land cover dynamics are essential for society to respond effectively to environmental changes and to manage human impacts on environmental systems" (NRC, 2001).
Two additional NRC reports emphasize the importance of land-use and land-cover change research. A 1999 report on Measures of Environmental Performance and Ecosystem Condition called for investigations of the complex relationships between humans and the environment and emphasized data collection and monitoring of both ecosystem processes and land use and land cover change (NRC, 1999). Another NRC report titled Ecological Indicators for the Nation declared that the largest ecological changes caused by humans result from land use (NRC, 2000). Because these changes affect the ability of ecosystems to provide the goods and services that society depends on, an assessment of land cover change is needed to understand the status of the Nation's biological resources.
While a great deal had been written regarding change-detection techniques using remotely sensed data, very little guidance existed for addressing large-area change detection (Dobson and Bright, 1994). Large-area change detection had generally relied on low-resolution sensors, such as the National Oceanic and Atmospheric Administration (NOAA) Advanced Very High Resolution Radiometer (AVHRR), to provide information on general changes in vegetation indices or similar measures (Tucker et a1., 1986; Helldenand Eklundh, 1988; Lambin and Strahler, 1994). The spatial resolution of such sensors, however, made it difficult to identify and quantify the types of fine-scale land cover changes that are often associated with anthropogenic change. The use of moderate-resolution imagery (i.e., 30-meters), such as Landsat TM data, made this task much more feasible. However, wall-to-wall change detection using moderate- to high-resolution imagery for large areas presented stiff challenges with respect to accuracy, time, processing loads, and budgets.
Spectral data recorded by remote sensing instruments can provide information on land cover conversions and on changes in condition, bbut were generally not a consistent indicator of land cover change. Land cover transitions often have very small changes in spectral response and may not be readily identifiable. Interpretation of tone, texture, shape, size, and pattern can all help to identify land cover change, but these elements are disregarded in many automated change analysis studies.
The most straightforward technique for detecting change is the comparison of land cover classifications from two dates. The use of independently produced classifications has the advantage of compensating for varied atmospheric and phenological conditions between dates, or even the use of different sensors between dates, because each classification is independently produced and mapped to a common thematic reference. The method has been criticized however, because it tends to compound any errors that may have occurred in the two initial classifications (Gordon, 1980; Stow et al., 1980; Singh, 1989). The procedure had been, however, successfully used in various land cover change investigations, including assessing deforestation (Massart et al., 1995), urbanization (Dimyati et al., 1996), sand dune changes (Kumar et al., 1993), and the conversion of semi natural vegetation to agricultural grassland (Wilcock and Cooper, 1993).
Simultaneous analysis techniques, including image differencing, ratioing, principal components analysis (PCA), and change vector analysis, were common change analysis approaches. Image differencing (i.e., subtraction between georegistered images (raw or transformed) from two dates) was probably the most widely used approach (Weismiller et al., 1977; Vogelmann, 1988). Image ratioing (Howarth and Wickware, 1981) and PCA (Bryne et al., 1980; Ribed and Lopez, 1995) have also been widely used. Sohl (1999) successfully used change vector analysis to document land cover change in the United Arab Emirates. Although often effective at identifying areas of spectral change, these techniques typically result in the creation of a simple, binary change masks.
Methods
Researchers with the United States Geological Survey's (USGS) Land Cover Trends Project created a dataset for the conterminous U.S. designed to characterize the historical state of the nation's land surface between 1973 and 2000. The dataset was needed to analyze patterns, rates, and trends in land-use/land-cover (LULC) change and to assess the causes and potential consequences of land change across the country (Loveland and others, 2002). The dataset shows the geographic variability and characteristics of 1973-2000 U.S. landscape change and provides a scientific foundation for assessing the environmental consequences of land change. Over 60 scientific papers have been published and the results have been the basis for collaborative studies of the environmental consequences of change with scientists from many organizations including the U.S. Geological Survey, U.S. Environmental Protection Agency, and National Aeronautics and Space Administration, National Oceanic and Atmospheric Association, National Science Foundation, U.S. Fish and Wildlife Service, and academia.
The U.S. had a number of programs that use statistical surveys and remote sensing approaches to generate land cover information. The Forest Inventory and Analysis Program of the U.S. Forest Service provides the information needed to assess status and trends in America's forests (Gillespie, 1999). The U.S. Department of Agriculture's Census of Agriculture is the leading source of facts and figures about American agriculture (USDA, 2009). The U.S. Department of Agriculture's National Resources Inventory is a statistical survey of land use and natural resource conditions and trends on non-Federal lands (USDA, 2009). Each effort contributed to our understanding of the land use and land cover, but none offered a complete, nationally comprehensive assessment of 1973 to 2000 land change based on methods that are spatially and temporally consistent across the U.S.
The Land Cover Trends dataset was created using a statistical sampling approach because it was a much more cost efficient method for characterizing LULC change over as large an area as the U.S. (Stehman and others, 2003). Ecological regions were used as a geographic framework for selecting sample blocks across the conterminous U.S. with a total of 2,688 sample blocks randomly selected from 84 Level III ecoregions (Omernik, 1987). Researchers manually interpreted Landsat MSS, TM and ETM+ imagery for five dates (1973, 1980, 1986, 1992, and 2000) and then used the land cover data to derive change statistics for each interval ( nominally1973-1980, 1980-1986, 1986-1992, and 1992-2000) and for the entire study period (1973-2000), ultimately serving as the basis for ecoregion-based change estimates used as the primary land-change metrics in reporting.
The change estimates are used to determine: (1) the predominant types of LULC conversions occurring within each ecoregion, (2) the estimated rates of change for these conversions, and (3) whether the types and rates of change are constant or variable across time. The analysis of change, which was conducted in several ecoregion publications (Sleeter and others, 2012), also involved looking for spatial correlations between conversion types and selected environmental factors, such as terrain characteristics, proximity to urban development, economic conditions, etc., in order to improve our understanding of potential drivers of change (Raumann and Soulard, 2007; Napton and others, 2010).
The Land Cover Trends project was first proposed by Loveland and others (1999), and the project methodology was later published by Loveland and others (2002). Additional details on sampling design were provided by Stehman and others (2003). Sleeter and others (2012) also provided a detailed description of each facet of the Land Cover Trends methodology. Here, we make a similar attempt to summarize the ecoregion framework, sampling strategy, source imagery, classification system, and manual interpretation process.
Classification System
The Land Cover Trends classification system used consisted of 11 general LULC classes. The LULC classes paralleled the Anderson Level I classification system (Anderson and others, 1976), but was modified by including two transitional disturbance categories; mechanically disturbed denotes human-induced disturbances and non-mechanically disturbed denotes natural disturbances. The decision to use general, Level I classes was primarily made to achieve high interpretation accuracy and consistency using moderate resolution imagery.
Since Landsat MSS, TM, and ETM+ imagery have limitations on what LULC categories can be correctly identified or what land change can be discerned between images, we erred on the side of creating LULC maps at the lower spatial resolution of the Landsat MSS imagery. A minimum mapping unit (MMU) of 60x60 meters was used for the study. This meant that features with ground footprints less than 60 meters wide, such as narrow roads or low-density development, were not mapped because they fell below the MMU.
Land-use and land-cover classification system used to develop data for the Land Cover Trends dataset
Water - Areas persistently covered with water, such as streams, canals, lakes, reservoirs, bays, or oceans.
Developed/urban - Areas of intensive use with much of the land covered with structures (e.g., high density residential, commercial, industrial, transportation, mining, confined livestock operations), or less intensive uses where the land cover matrix includes both vegetation and structures (e.g., low density residential, recreational facilities, cemeteries, etc.), including any land functionally attached to the urban or built-up activity.
Mechanically disturbed* - Land in an altered and often non-vegetated state that, due to disturbances by mechanical means, is in transition from one cover type to another. Mechanical disturbances include forest clear-cutting, earthmoving, scraping, chaining, reservoir drawdown, and other similar human-induced changes.
Barren - Land comprised of natural occurrences of soils, sand, or rocks where less than 10% of the area is vegetated.
Mining - Areas with extractive mining activities that have a significant surface expression. This includes (to the extent that these features can be detected) mining buildings, quarry pits, overburden, leach, evaporative, tailing, or other related components.
Forests/woodlands - Tree-covered land where the tree-cover density is greater than 10%. Note that cleared forest land (i.e., clear-cut logging) will be mapped according to current cover (e.g., disturbed or transitional, shrubland/grassland).
Grassland/shrubland - Land predominately covered with grasses, forbs, or shrubs. The vegetated cover must comprise at least 10% of the area.
Agriculture - Cropland or pastureland in either a vegetated or non-vegetated state used for the production of food and fiber. Note that forest plantations are considered as forests or woodlands regardless of the use of the wood products.
Wetland - Lands where water saturation is the determining factor in soil characteristics, vegetation types, and animal communities. Wetlands are comprised of water and vegetated cover.
Nonmechanically disturbed* - Land in an altered and often non-vegetated state that, due to disturbances by nonmechanical means, is in transition from one cover type to another. Nonmechanical disturbances are caused by wind, floods, fire, animals, and other similar phenomenon.
Ice/snow - Land where the accumulation of snow and ice does not completely melt during the summer period.
Ecoregion Framework
A central premise of the project strategy was that EPA Level III ecoregions can provide an ideal geographic framework for characterizing regional LULC change. The ecoregion boundaries used were originally defined by Omernik (1987) and then revised by 1999 (USEPA, 1999). The spatial boundaries were developed by synthesizing information on climate, geology, physiography, soils, vegetation, hydrology, and human factors, such that the ecoregions reflect patterns of land-cover and land-use potential that correlate with patterns visible in remotely sensed data. This set of factors makes ecoregions suitable to tell regional stories of change, highlighting how land-use/land-cover patterns, disturbance types and frequencies, environmental issues of concern, and management practices and consequences that are similar regionally yet differ across the country. Land Cover Trends also employed this framework because ecoregions (1) provide a means to localize estimates of the rates and driving forces of change, (2) play a significant role in determining the range of current LULC types, and the trajectories of land use and land cover that may take place in the future, and (3) provide a framework that can be extended globally.
Sampling Strategy
LULC composition and change was determined using a probability sample of 2,688 blocks randomly selected within 84 EPA Level III ecoregions. The probabilistic nature of the sampling strategy created derived estimates categorically "representative" of the population (Kish, 1987). The size of each sample block and the number of samples in each ecoregion was established by trying to strike a balance between estimating change in LULC area and estimating change in landscape pattern. The initial design used a 20-km square sample size. Nine ecoregions were analyzed using 9 to 11 randomly selected 20-km by 20-km sample blocks per ecoregion. The remaining 75 ecoregions used 25 to 48 randomly selected 10-km by 10-km sample blocks because a greater number of smaller samples would favor better estimates of change in area and type over better characterization of change in landscape pattern.
The number of samples was determined by an expert panel based on expected land-change characteristics and a desire to measure change within +/-1% margin of error at an 85% confidence level. Sample selection involved overlaying a regular grid of 10-km by 10-km (or 20-km by 20-km) blocks over the conterminous U.S. and assigning blocks to a specific ecoregion following a centroid spatial allocation rule. The blocks within each ecoregion were then assigned a unique numerical value from 1 to N. A random number generator was used to select actual sample blocks one at a time until the total number of desired blocks was met.
Landsat Source Data
For each sample block, five dates of Landsat imagery were used to interpret and map LULC. The Landsat imagery provided a consistent, synoptic, multispectral view of the land surface from which information on LULC could be interpreted for the period from 1973 to 2000.
Imagery from the Landsat Multispectral Scanner (MSS), Thematic Mapper (TM), and Enhanced Thematic Mapper Plus (ETM+) instruments was acquired from the North American Landscape Characterization (NALC) project (Lunetta and others, 1998), the Multi-Resolution Land Characteristics Consortium (MRLC) Landsat Scene Library (MRLC, 2012), and the National Satellite Land Remote Sensing Data Archive. Landsat imagery from NALC and MRLC had been used in other land characterization efforts and had the added benefit of low cost (prior to the Landsat archive becoming free to download) and robust pre-processing. The scenes obtained from NALC and MRLC were previously georeferenced to root-mean-square errors of 1 pixel or less. Additionally, the majority of the NALC MSS data had also been terrain corrected. The Landsat scenes selected for the national Land Cover Trends mapping effort were spaced at semi-regular, 6 to 8 years intervals (circa 1973, 1980, 1986, 1992, and 2000).
Landsat data used to develop the Land Cover Trends dataset
[Land Cover Trends largely leveraged Landsat imagery acquired by the North American Landscape Characterization (NALC) project and the Multi-Resolution Land Characteristics Consortium (MRLC) Landsat Scene Library. New acquisitions from the National Satellite Land Remote Sensing Data Archive (NSLRSDA) were made to provide imagery circa 1980. Many of these data were available at no charge, and included additional pre-processing measures/steps to maintain registration consistency.]
Below are other science projects associated with this project.

National Land Change Assessment

Patterns in the Landscape – Analyses of Cause and Effect
- Overview
Land Cover Trends was a research project focused on understanding the rates, trends, causes, and consequences of contemporary U.S. land use and land cover change. The project spanned from 1999 to 2011. The research was supported by the Climate and Land Use Change Research and Development Program of the U.S. Geological Survey (USGS) and was a collaborative effort with the U.S. Environmental Protection Agency (EPA) and the National Aeronautics and Space Administration (NASA). The project spanned from 1999 to 2011. Ongoing research is being conducted as part of the Land Change Research Project.
Background
A clear call for research on land use and land cover change resulted from the National Research Council (NRC) response to a National Science Foundation (NSF) request to identify the "Grand Challenges in Environmental Sciences" (NRC, 2001). An interdisciplinary committee was asked to determine the most important research challenges over the next 20 to 30 years within the context of environmental problems. One of eight grand challenges was Land Use Dynamics, which calls for the development of a comprehensive understanding of changes in land use and land cover that are critical to biogeochemical cycling, ecosystem functioning and services, and human welfare. The report concluded that “…improved information on and understanding of land use and land cover dynamics are essential for society to respond effectively to environmental changes and to manage human impacts on environmental systems" (NRC, 2001).
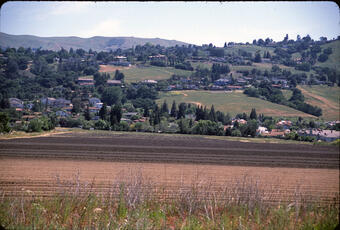
Sources/Usage: Public Domain. View Media DetailsFallow field with exurban development in the background in California. This photo was taken for the Trends Landcover project during field work. (Credit: U.S. Geological Survey. Public domain.) Two additional NRC reports emphasize the importance of land-use and land-cover change research. A 1999 report on Measures of Environmental Performance and Ecosystem Condition called for investigations of the complex relationships between humans and the environment and emphasized data collection and monitoring of both ecosystem processes and land use and land cover change (NRC, 1999). Another NRC report titled Ecological Indicators for the Nation declared that the largest ecological changes caused by humans result from land use (NRC, 2000). Because these changes affect the ability of ecosystems to provide the goods and services that society depends on, an assessment of land cover change is needed to understand the status of the Nation's biological resources.
While a great deal had been written regarding change-detection techniques using remotely sensed data, very little guidance existed for addressing large-area change detection (Dobson and Bright, 1994). Large-area change detection had generally relied on low-resolution sensors, such as the National Oceanic and Atmospheric Administration (NOAA) Advanced Very High Resolution Radiometer (AVHRR), to provide information on general changes in vegetation indices or similar measures (Tucker et a1., 1986; Helldenand Eklundh, 1988; Lambin and Strahler, 1994). The spatial resolution of such sensors, however, made it difficult to identify and quantify the types of fine-scale land cover changes that are often associated with anthropogenic change. The use of moderate-resolution imagery (i.e., 30-meters), such as Landsat TM data, made this task much more feasible. However, wall-to-wall change detection using moderate- to high-resolution imagery for large areas presented stiff challenges with respect to accuracy, time, processing loads, and budgets.
Spectral data recorded by remote sensing instruments can provide information on land cover conversions and on changes in condition, bbut were generally not a consistent indicator of land cover change. Land cover transitions often have very small changes in spectral response and may not be readily identifiable. Interpretation of tone, texture, shape, size, and pattern can all help to identify land cover change, but these elements are disregarded in many automated change analysis studies.
The most straightforward technique for detecting change is the comparison of land cover classifications from two dates. The use of independently produced classifications has the advantage of compensating for varied atmospheric and phenological conditions between dates, or even the use of different sensors between dates, because each classification is independently produced and mapped to a common thematic reference. The method has been criticized however, because it tends to compound any errors that may have occurred in the two initial classifications (Gordon, 1980; Stow et al., 1980; Singh, 1989). The procedure had been, however, successfully used in various land cover change investigations, including assessing deforestation (Massart et al., 1995), urbanization (Dimyati et al., 1996), sand dune changes (Kumar et al., 1993), and the conversion of semi natural vegetation to agricultural grassland (Wilcock and Cooper, 1993).
Simultaneous analysis techniques, including image differencing, ratioing, principal components analysis (PCA), and change vector analysis, were common change analysis approaches. Image differencing (i.e., subtraction between georegistered images (raw or transformed) from two dates) was probably the most widely used approach (Weismiller et al., 1977; Vogelmann, 1988). Image ratioing (Howarth and Wickware, 1981) and PCA (Bryne et al., 1980; Ribed and Lopez, 1995) have also been widely used. Sohl (1999) successfully used change vector analysis to document land cover change in the United Arab Emirates. Although often effective at identifying areas of spectral change, these techniques typically result in the creation of a simple, binary change masks.
Methods
Researchers with the United States Geological Survey's (USGS) Land Cover Trends Project created a dataset for the conterminous U.S. designed to characterize the historical state of the nation's land surface between 1973 and 2000. The dataset was needed to analyze patterns, rates, and trends in land-use/land-cover (LULC) change and to assess the causes and potential consequences of land change across the country (Loveland and others, 2002). The dataset shows the geographic variability and characteristics of 1973-2000 U.S. landscape change and provides a scientific foundation for assessing the environmental consequences of land change. Over 60 scientific papers have been published and the results have been the basis for collaborative studies of the environmental consequences of change with scientists from many organizations including the U.S. Geological Survey, U.S. Environmental Protection Agency, and National Aeronautics and Space Administration, National Oceanic and Atmospheric Association, National Science Foundation, U.S. Fish and Wildlife Service, and academia.
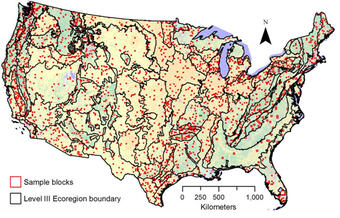
Sources/Usage: Public Domain. View Media DetailsMap showing the locations of the 2,688 sample blocks that comprise the Land Cover Trends dataset. The red squares indicate locations of the 10 km x 10 km and/or 20 km x 20 km sample blocks. The base map is the 1992 National Land Cover Dataset (Vogelmann and others, 2001). (Public domain.) The U.S. had a number of programs that use statistical surveys and remote sensing approaches to generate land cover information. The Forest Inventory and Analysis Program of the U.S. Forest Service provides the information needed to assess status and trends in America's forests (Gillespie, 1999). The U.S. Department of Agriculture's Census of Agriculture is the leading source of facts and figures about American agriculture (USDA, 2009). The U.S. Department of Agriculture's National Resources Inventory is a statistical survey of land use and natural resource conditions and trends on non-Federal lands (USDA, 2009). Each effort contributed to our understanding of the land use and land cover, but none offered a complete, nationally comprehensive assessment of 1973 to 2000 land change based on methods that are spatially and temporally consistent across the U.S.
The Land Cover Trends dataset was created using a statistical sampling approach because it was a much more cost efficient method for characterizing LULC change over as large an area as the U.S. (Stehman and others, 2003). Ecological regions were used as a geographic framework for selecting sample blocks across the conterminous U.S. with a total of 2,688 sample blocks randomly selected from 84 Level III ecoregions (Omernik, 1987). Researchers manually interpreted Landsat MSS, TM and ETM+ imagery for five dates (1973, 1980, 1986, 1992, and 2000) and then used the land cover data to derive change statistics for each interval ( nominally1973-1980, 1980-1986, 1986-1992, and 1992-2000) and for the entire study period (1973-2000), ultimately serving as the basis for ecoregion-based change estimates used as the primary land-change metrics in reporting.
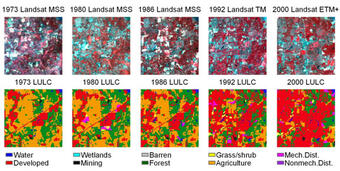
Sources/Usage: Public Domain. View Media DetailsAn example of the 5 dates of land-use and land-cover data available for each sample block. The data shown here is for sample 74_0134 in the Mississippi Valley Loess Plains ecoregion, located on the northeastern edge of Memphis, Tennessee. Note-the Landsat imagery are not available for download as part of this paper. (Public domain.) The change estimates are used to determine: (1) the predominant types of LULC conversions occurring within each ecoregion, (2) the estimated rates of change for these conversions, and (3) whether the types and rates of change are constant or variable across time. The analysis of change, which was conducted in several ecoregion publications (Sleeter and others, 2012), also involved looking for spatial correlations between conversion types and selected environmental factors, such as terrain characteristics, proximity to urban development, economic conditions, etc., in order to improve our understanding of potential drivers of change (Raumann and Soulard, 2007; Napton and others, 2010).
The Land Cover Trends project was first proposed by Loveland and others (1999), and the project methodology was later published by Loveland and others (2002). Additional details on sampling design were provided by Stehman and others (2003). Sleeter and others (2012) also provided a detailed description of each facet of the Land Cover Trends methodology. Here, we make a similar attempt to summarize the ecoregion framework, sampling strategy, source imagery, classification system, and manual interpretation process.
Classification System
The Land Cover Trends classification system used consisted of 11 general LULC classes. The LULC classes paralleled the Anderson Level I classification system (Anderson and others, 1976), but was modified by including two transitional disturbance categories; mechanically disturbed denotes human-induced disturbances and non-mechanically disturbed denotes natural disturbances. The decision to use general, Level I classes was primarily made to achieve high interpretation accuracy and consistency using moderate resolution imagery.
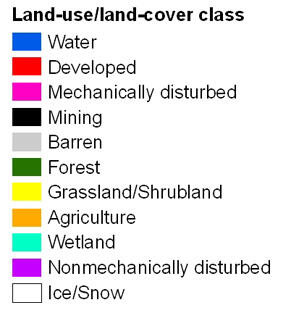
Sources/Usage: Public Domain. View Media DetailsThe key for the classification land cover types for Land Cover Trends Project.(Public domain.) Since Landsat MSS, TM, and ETM+ imagery have limitations on what LULC categories can be correctly identified or what land change can be discerned between images, we erred on the side of creating LULC maps at the lower spatial resolution of the Landsat MSS imagery. A minimum mapping unit (MMU) of 60x60 meters was used for the study. This meant that features with ground footprints less than 60 meters wide, such as narrow roads or low-density development, were not mapped because they fell below the MMU.
Land-use and land-cover classification system used to develop data for the Land Cover Trends dataset
Water - Areas persistently covered with water, such as streams, canals, lakes, reservoirs, bays, or oceans.
Developed/urban - Areas of intensive use with much of the land covered with structures (e.g., high density residential, commercial, industrial, transportation, mining, confined livestock operations), or less intensive uses where the land cover matrix includes both vegetation and structures (e.g., low density residential, recreational facilities, cemeteries, etc.), including any land functionally attached to the urban or built-up activity.
Mechanically disturbed* - Land in an altered and often non-vegetated state that, due to disturbances by mechanical means, is in transition from one cover type to another. Mechanical disturbances include forest clear-cutting, earthmoving, scraping, chaining, reservoir drawdown, and other similar human-induced changes.
Barren - Land comprised of natural occurrences of soils, sand, or rocks where less than 10% of the area is vegetated.
Mining - Areas with extractive mining activities that have a significant surface expression. This includes (to the extent that these features can be detected) mining buildings, quarry pits, overburden, leach, evaporative, tailing, or other related components.
Forests/woodlands - Tree-covered land where the tree-cover density is greater than 10%. Note that cleared forest land (i.e., clear-cut logging) will be mapped according to current cover (e.g., disturbed or transitional, shrubland/grassland).
Grassland/shrubland - Land predominately covered with grasses, forbs, or shrubs. The vegetated cover must comprise at least 10% of the area.
Agriculture - Cropland or pastureland in either a vegetated or non-vegetated state used for the production of food and fiber. Note that forest plantations are considered as forests or woodlands regardless of the use of the wood products.
Wetland - Lands where water saturation is the determining factor in soil characteristics, vegetation types, and animal communities. Wetlands are comprised of water and vegetated cover.
Nonmechanically disturbed* - Land in an altered and often non-vegetated state that, due to disturbances by nonmechanical means, is in transition from one cover type to another. Nonmechanical disturbances are caused by wind, floods, fire, animals, and other similar phenomenon.
Ice/snow - Land where the accumulation of snow and ice does not completely melt during the summer period.
Ecoregion Framework
A central premise of the project strategy was that EPA Level III ecoregions can provide an ideal geographic framework for characterizing regional LULC change. The ecoregion boundaries used were originally defined by Omernik (1987) and then revised by 1999 (USEPA, 1999). The spatial boundaries were developed by synthesizing information on climate, geology, physiography, soils, vegetation, hydrology, and human factors, such that the ecoregions reflect patterns of land-cover and land-use potential that correlate with patterns visible in remotely sensed data. This set of factors makes ecoregions suitable to tell regional stories of change, highlighting how land-use/land-cover patterns, disturbance types and frequencies, environmental issues of concern, and management practices and consequences that are similar regionally yet differ across the country. Land Cover Trends also employed this framework because ecoregions (1) provide a means to localize estimates of the rates and driving forces of change, (2) play a significant role in determining the range of current LULC types, and the trajectories of land use and land cover that may take place in the future, and (3) provide a framework that can be extended globally.
Sampling Strategy
LULC composition and change was determined using a probability sample of 2,688 blocks randomly selected within 84 EPA Level III ecoregions. The probabilistic nature of the sampling strategy created derived estimates categorically "representative" of the population (Kish, 1987). The size of each sample block and the number of samples in each ecoregion was established by trying to strike a balance between estimating change in LULC area and estimating change in landscape pattern. The initial design used a 20-km square sample size. Nine ecoregions were analyzed using 9 to 11 randomly selected 20-km by 20-km sample blocks per ecoregion. The remaining 75 ecoregions used 25 to 48 randomly selected 10-km by 10-km sample blocks because a greater number of smaller samples would favor better estimates of change in area and type over better characterization of change in landscape pattern.
The number of samples was determined by an expert panel based on expected land-change characteristics and a desire to measure change within +/-1% margin of error at an 85% confidence level. Sample selection involved overlaying a regular grid of 10-km by 10-km (or 20-km by 20-km) blocks over the conterminous U.S. and assigning blocks to a specific ecoregion following a centroid spatial allocation rule. The blocks within each ecoregion were then assigned a unique numerical value from 1 to N. A random number generator was used to select actual sample blocks one at a time until the total number of desired blocks was met.
Landsat Source Data
For each sample block, five dates of Landsat imagery were used to interpret and map LULC. The Landsat imagery provided a consistent, synoptic, multispectral view of the land surface from which information on LULC could be interpreted for the period from 1973 to 2000.
Imagery from the Landsat Multispectral Scanner (MSS), Thematic Mapper (TM), and Enhanced Thematic Mapper Plus (ETM+) instruments was acquired from the North American Landscape Characterization (NALC) project (Lunetta and others, 1998), the Multi-Resolution Land Characteristics Consortium (MRLC) Landsat Scene Library (MRLC, 2012), and the National Satellite Land Remote Sensing Data Archive. Landsat imagery from NALC and MRLC had been used in other land characterization efforts and had the added benefit of low cost (prior to the Landsat archive becoming free to download) and robust pre-processing. The scenes obtained from NALC and MRLC were previously georeferenced to root-mean-square errors of 1 pixel or less. Additionally, the majority of the NALC MSS data had also been terrain corrected. The Landsat scenes selected for the national Land Cover Trends mapping effort were spaced at semi-regular, 6 to 8 years intervals (circa 1973, 1980, 1986, 1992, and 2000).
Landsat data used to develop the Land Cover Trends dataset
[Land Cover Trends largely leveraged Landsat imagery acquired by the North American Landscape Characterization (NALC) project and the Multi-Resolution Land Characteristics Consortium (MRLC) Landsat Scene Library. New acquisitions from the National Satellite Land Remote Sensing Data Archive (NSLRSDA) were made to provide imagery circa 1980. Many of these data were available at no charge, and included additional pre-processing measures/steps to maintain registration consistency.]
- Science
Below are other science projects associated with this project.
National Land Change Assessment
The National Land Change Assessment (NLCA) is a research effort that examines the causes, trends, and implications of United States land change. The project takes a comprehensive approach towards understanding land change by systematically examining land conversion and management across a full range of land use and land cover types and climate and ecological settings. Land change is a key driver...Patterns in the Landscape – Analyses of Cause and Effect
Understanding the rates and causes of land-use/land-cover (LULC) change helps answer questions about what, where, how, and why the Earth’s surface is changing. Land-surface change results from human activities or natural processes like floods, droughts, and wildfires, and many of these change processes are observable in satellite imagery. The growing historical catalog of satellite images allows... - Data
- Publications
- Web Tools
- News
- Partners